4 guides ready to print - choose Save as PDF in the print window for a handout. Back to the help centre
TinERP user guide
Reports
Everyone who follows the figures · The report library, building your own reports, dashboards, and reports sent on a schedule.
Printed 3 October 2026 · the latest version is always in the help centre online
Contents
Reports
Find and run a report
Build and share your own reports
Dashboards
Reports on a schedule
Reports · Everyone with Reports · about 4 min
Find and run a report
Reports → Report library lists every report you can run, from each module in your plan. What any report shows follows your own access - a manager sees their department, HR everyone.
1. Find a report
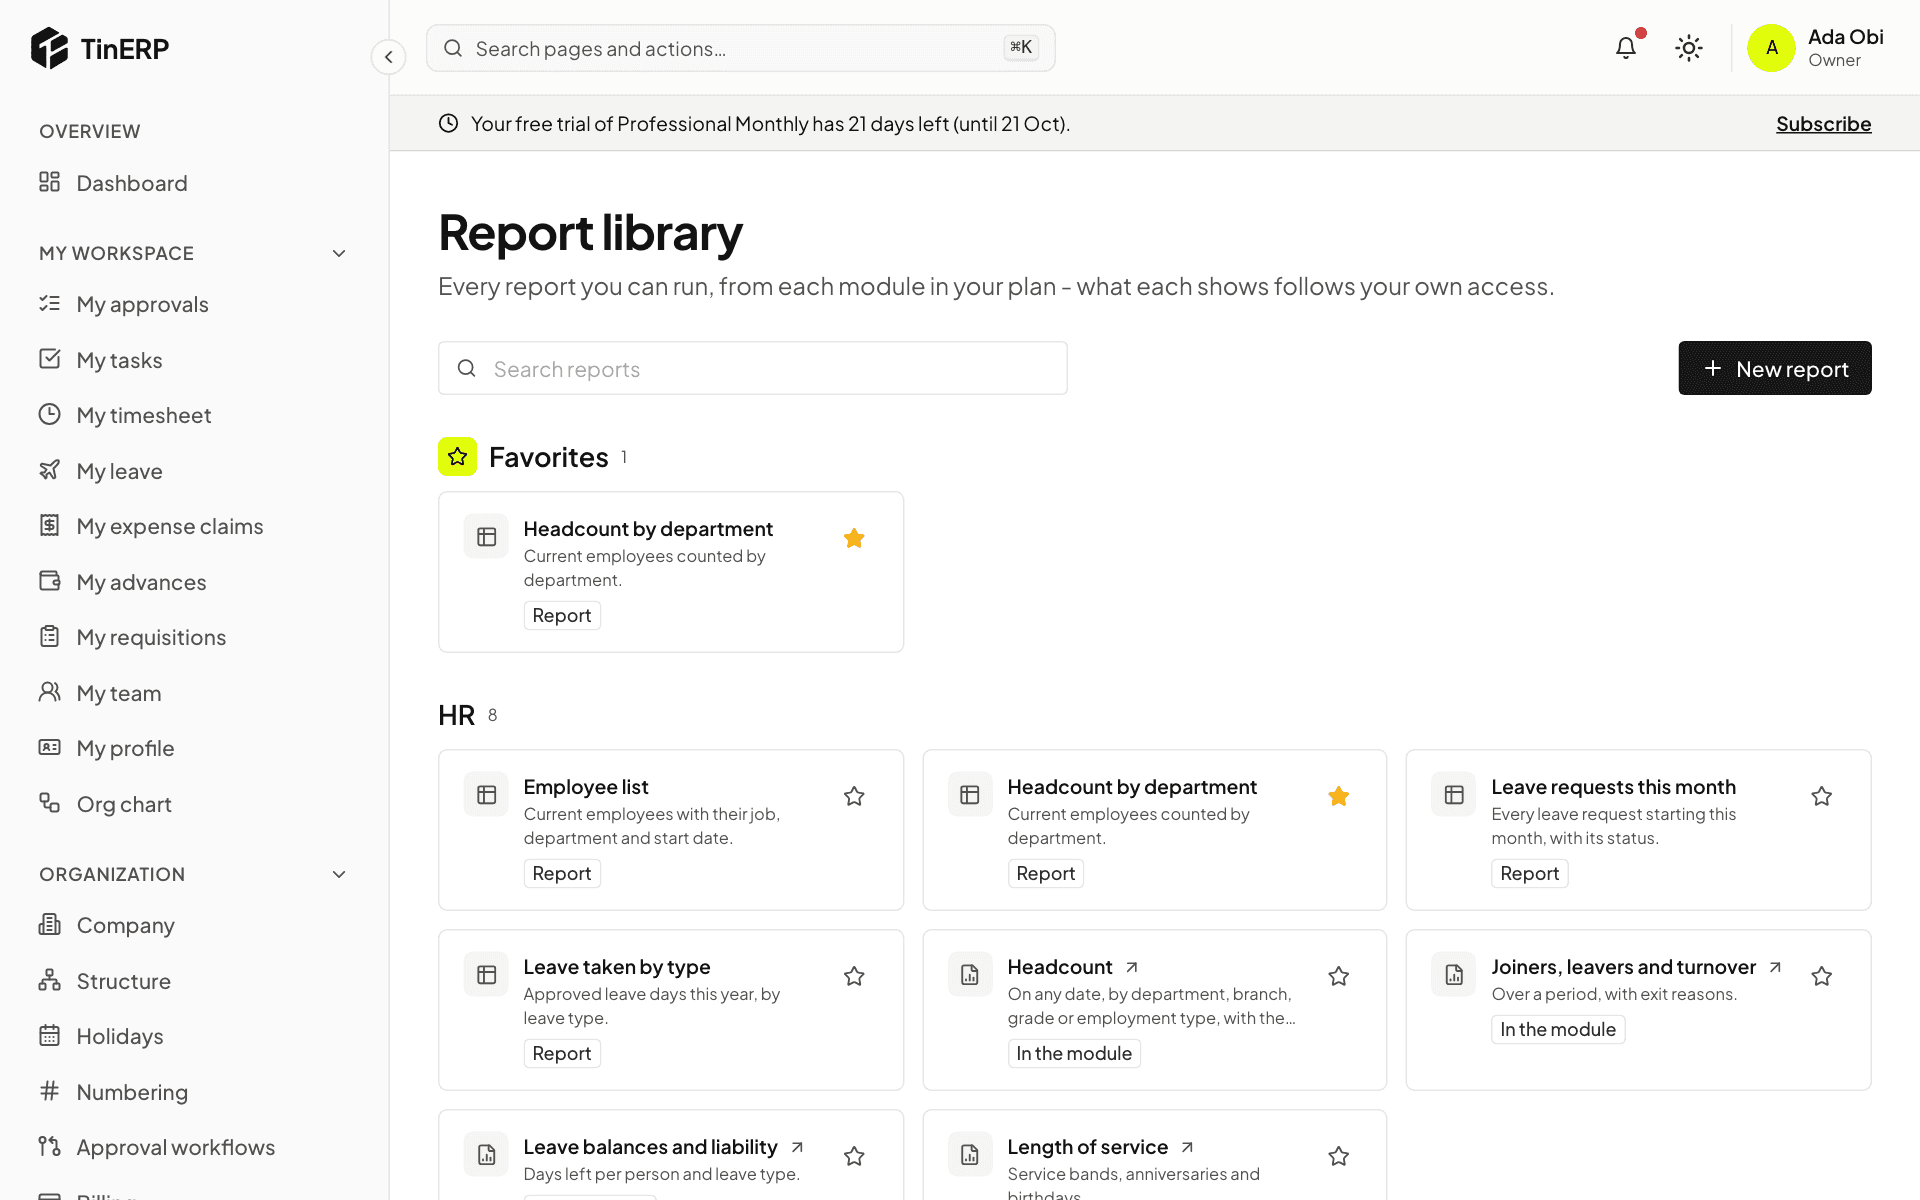
Go to Reports → Report library. Reports are grouped by module, with your Favorites at the top. Search by name.
Most open here. Those marked In the module - HR reports, the financial statements, aged receivables and others - open in their own module. Select the star to make any report a favorite.
The report library: a favorite at the top, then HR's reports
2. Run it your way
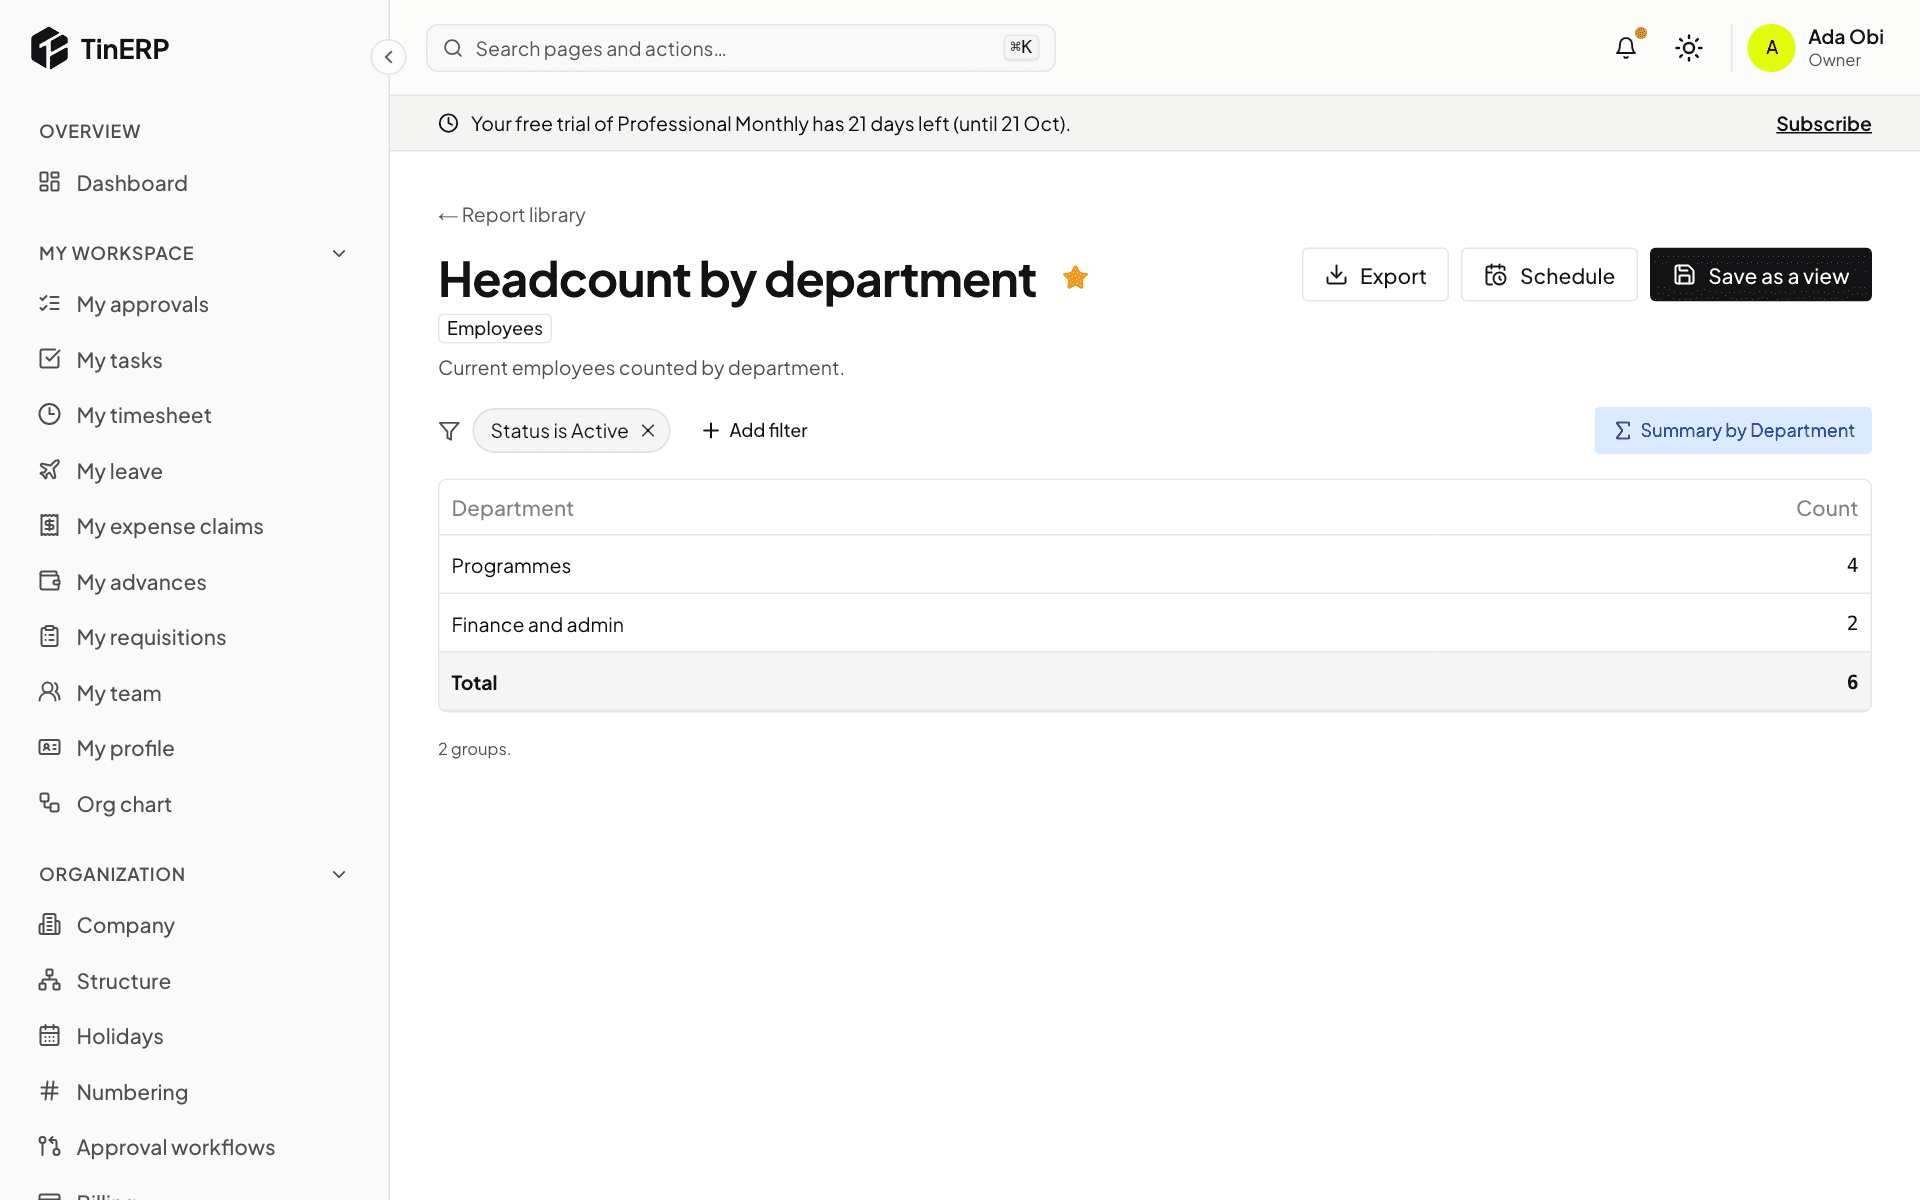
Open a report. The chips at the top are its filters - remove one, or Add filter on any field: a value, a range, text it contains, or a relative period such as this month or last quarter, which moves with the calendar.
Choose the columns to show and sort by any column. Totals cover every matching row, even when the screen shows the first 1,000. Select a row to open its record.
The Headcount by department report, with its filter, Export, Schedule and Save as a view
3. Export it
Select Export: CSV for anyone; Excel - numbers and dates stay numbers and dates, with a totals row - and PDF on your letterhead need the export permission. A very large report is made in the background: you're told when it's ready, and it's waiting in Reports → My report files for 7 days.
Tip: Every export is recorded in the audit log - who, which report, which filters.
Reports · Managers and admins · about 5 min
Build and share your own reports
You don't need to write anything technical: you choose the data, the columns, the filters and how to summarize it.
1. Start a report
In the library, select New report and choose the data - employees, leave requests, purchase orders, expense claims, journal lines, timesheet entries and more, as your plan and access allow. Or open any report and change it.
2. Summarize it
Select Summarize and choose: A list of rows; Group and total - up to three groupings (Then by) and up to four figures (count, total, average, lowest, highest), with a chart above the table if you like; or a Pivot - rows × columns × a figure, with totals across and down.
In a filter, My department follows whoever runs the report, so one shared report shows each manager their own department.
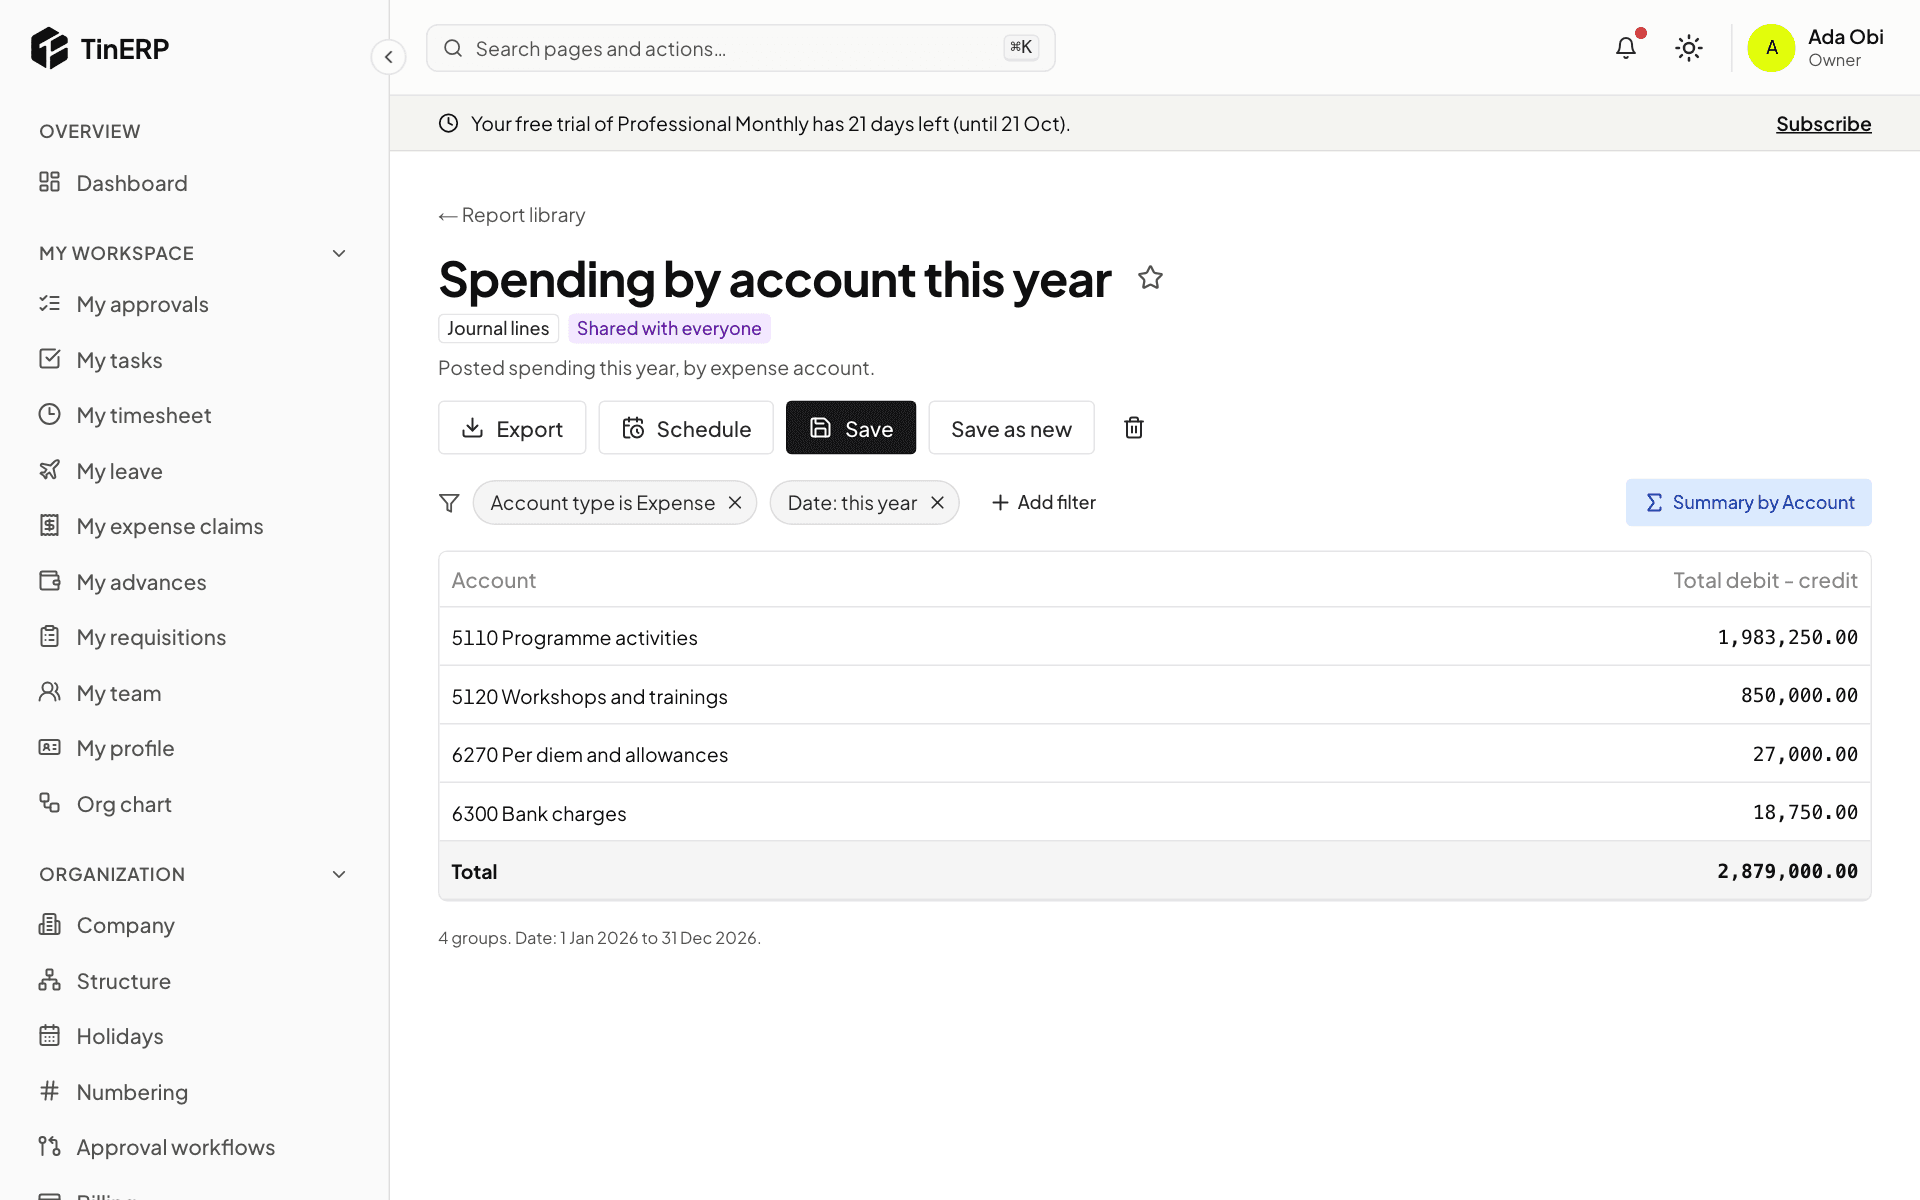
A saved view of spending by account, summarized by account, shared with everyone
3. Save and share it
Select Save as a view, name it, and choose Who sees it: only you, some roles, or everyone. Each person who opens it sees what their own access allows. Only you can change it; others can Save as new.
Reports · Everyone with Reports · about 4 min
Dashboards
A dashboard puts the figures you watch on one page, for one date range and department, each opening the report behind it.
1. Start from one of ours
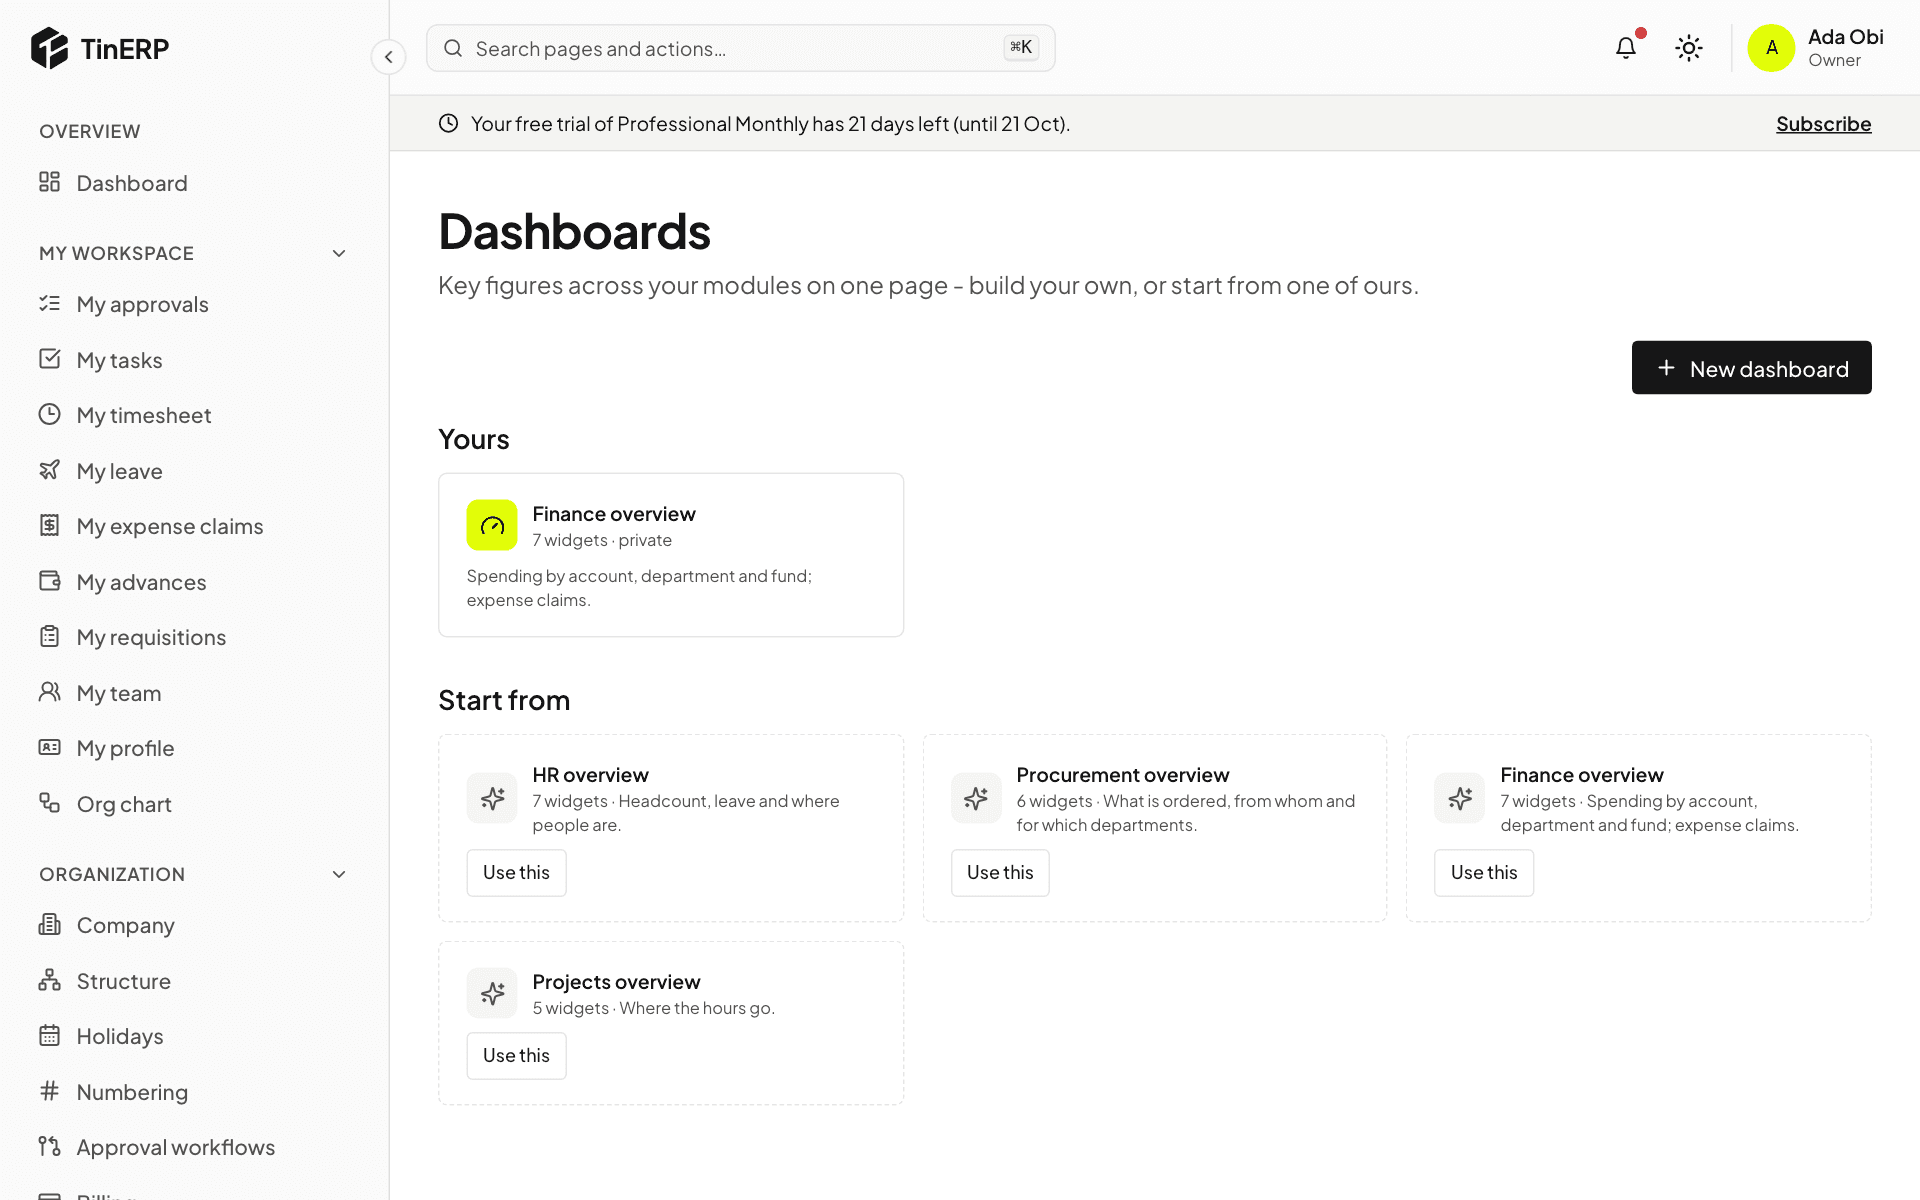
Go to Reports → Dashboards. Start from has an overview for each module in your plan - HR, Procurement, Finance, Projects. Select Use this to make it yours, or New dashboard to start empty.
Dashboards: yours, and the starters to copy
2. Read it
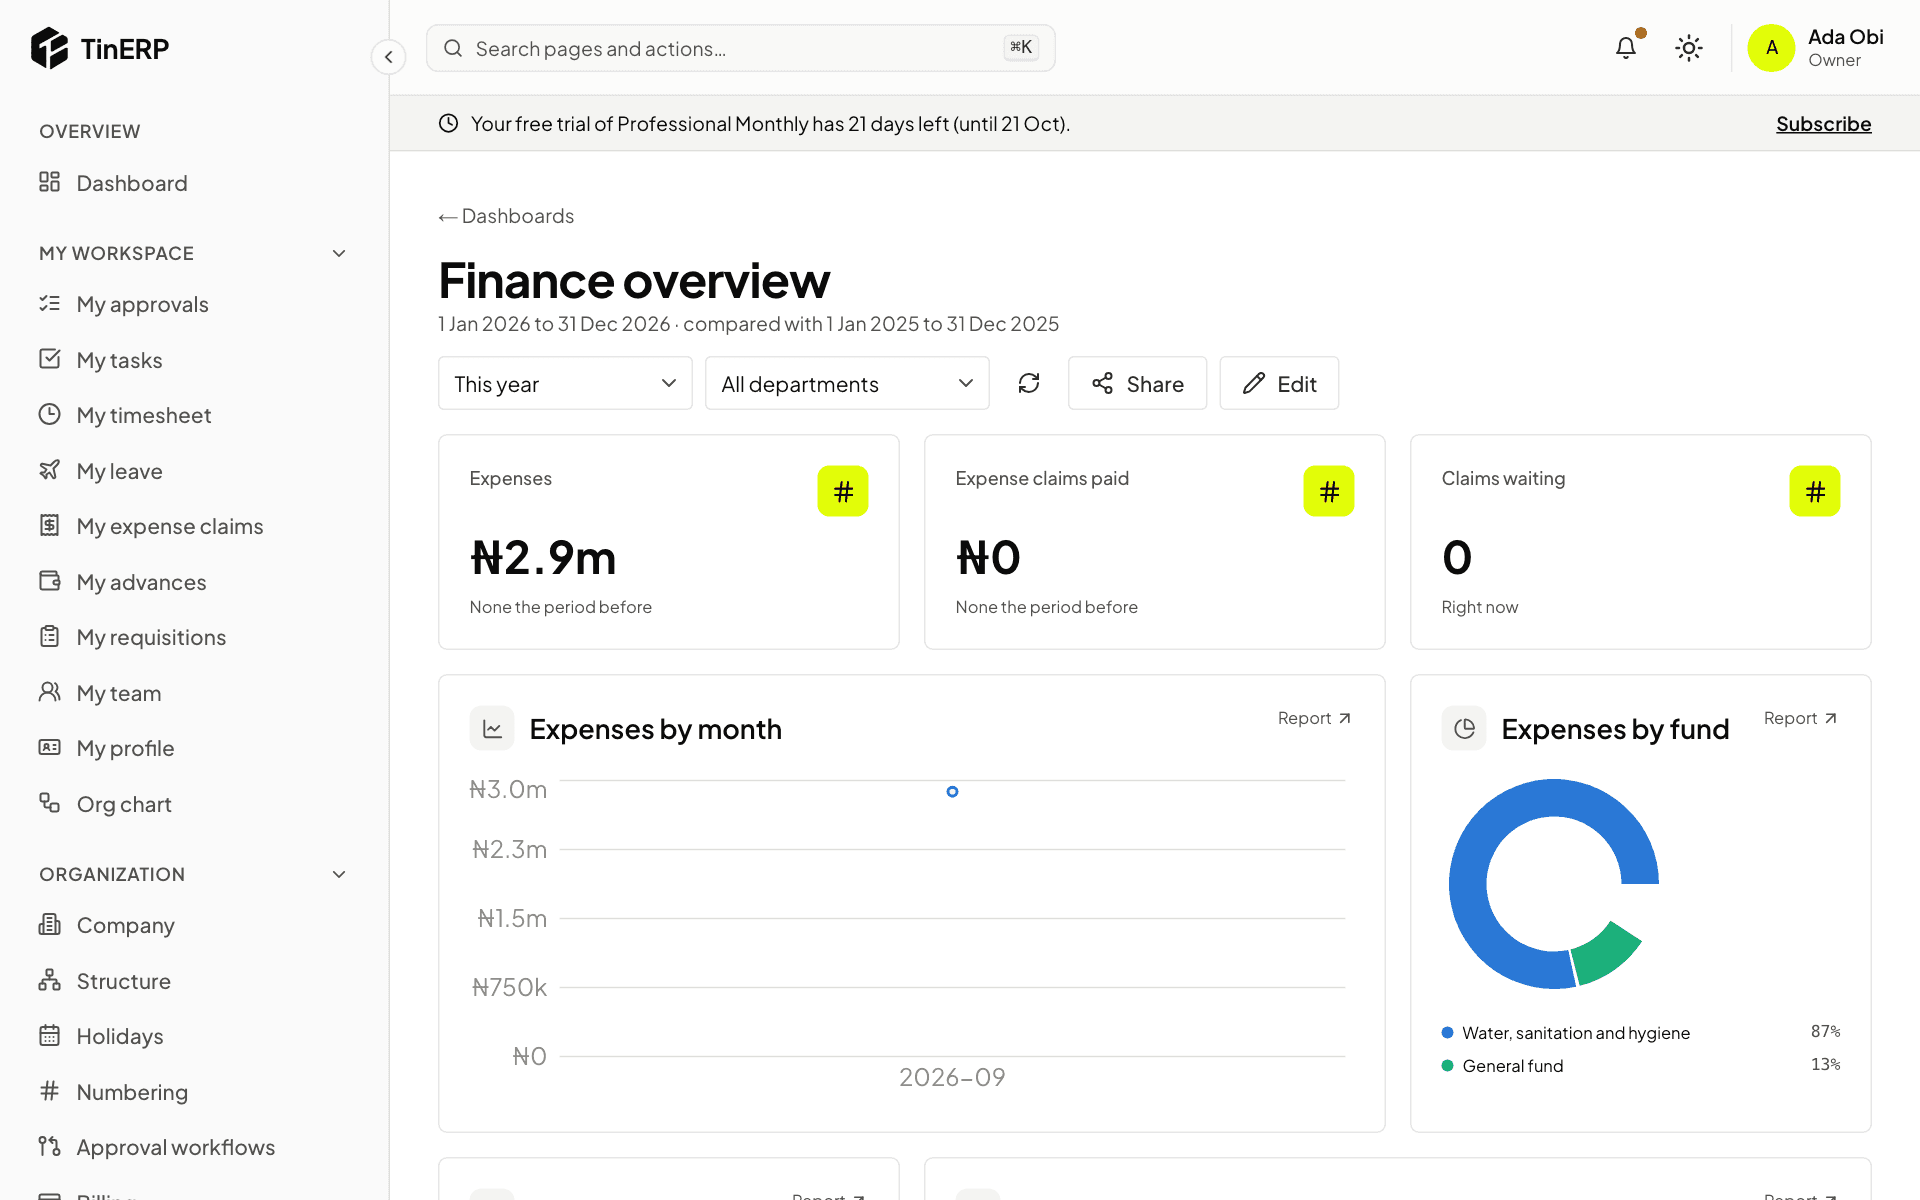
Choose the date range and department at the top - every widget that follows the dashboard's dates changes with them. Key figures show the change on the period before. Select Report on any widget for the figures behind it, ready to filter or export.
The Finance overview dashboard: expenses, claims, expenses by month and by fund
3. Make it yours
Select Edit, then Add a widget: choose the data, show it as a Key figure, Bar chart, Trend line, Donut, Ranked list or Table, and its width. Move and resize widgets; everything saves as you go.
Share it with roles or everyone - and make it a role's default - if your role allows. Each viewer sees their own access.
Reports · Managers and admins · about 3 min
Reports on a schedule
A scheduled report is made for each person it's sent to, with their own access - so one schedule gives each manager their own department's figures.
1. Schedule a report
Open the report or saved view and select Schedule: daily, weekly on a day, or monthly on a date, at a time; as PDF, Excel or CSV; Send to chosen people and everyone with a role. Tick to skip sending when there's nothing in it.
Relative periods - last month, month to date - keep a schedule meaningful.
2. Follow your schedules
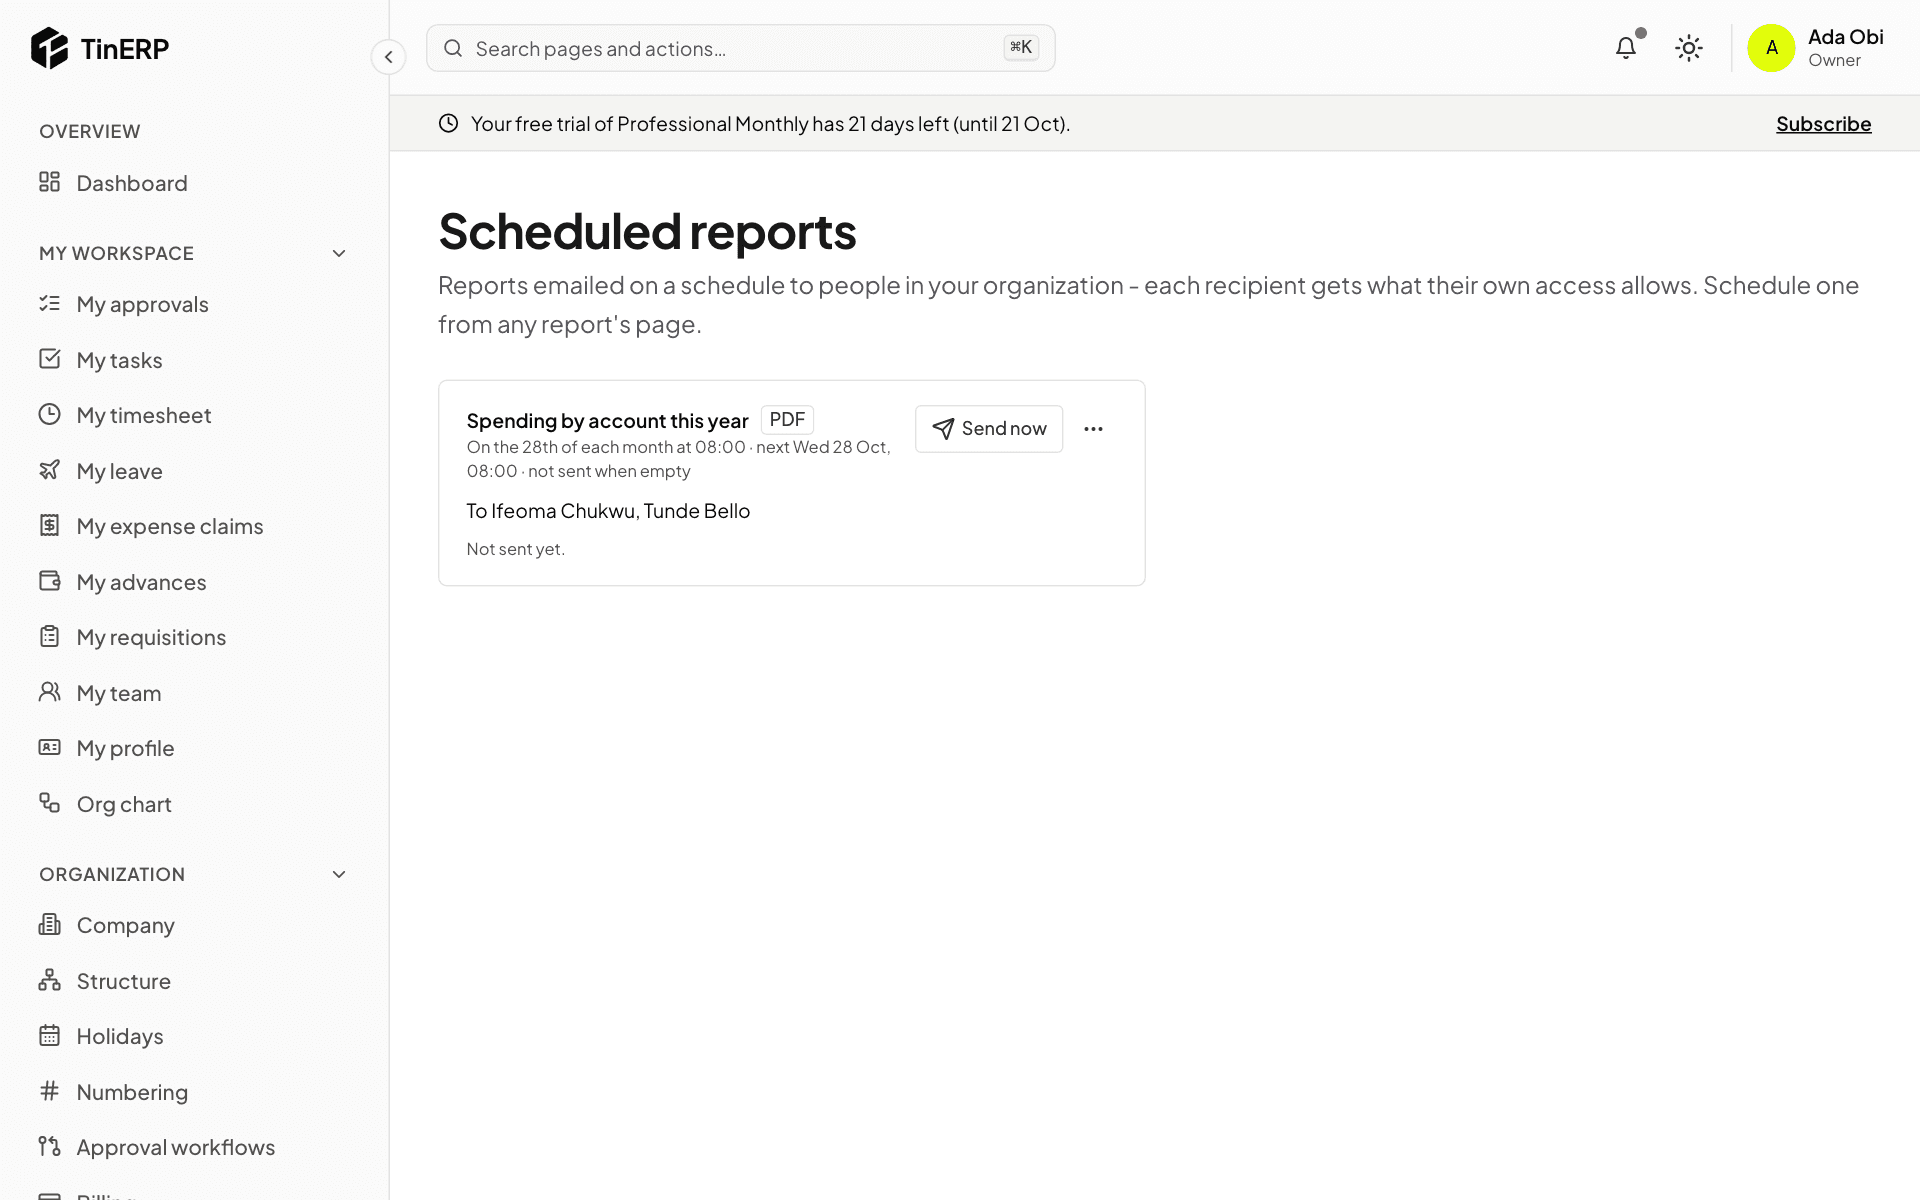
Reports → Scheduled reports shows each one: when it runs, to whom, and how the last run went. Send now runs it at once; the menu pauses or deletes it.
Each recipient is told, and finds their copy in Reports → My report files - the report itself never travels in the email.
Scheduled reports: a monthly PDF to two people, with Send now