Reports · Managers and admins · about 5 min
Build and share your own reports
You don't need to write anything technical: you choose the data, the columns, the filters and how to summarize it.
1. Start a report
In the library, select New report and choose the data - employees, leave requests, purchase orders, expense claims, journal lines, timesheet entries and more, as your plan and access allow. Or open any report and change it.
2. Summarize it
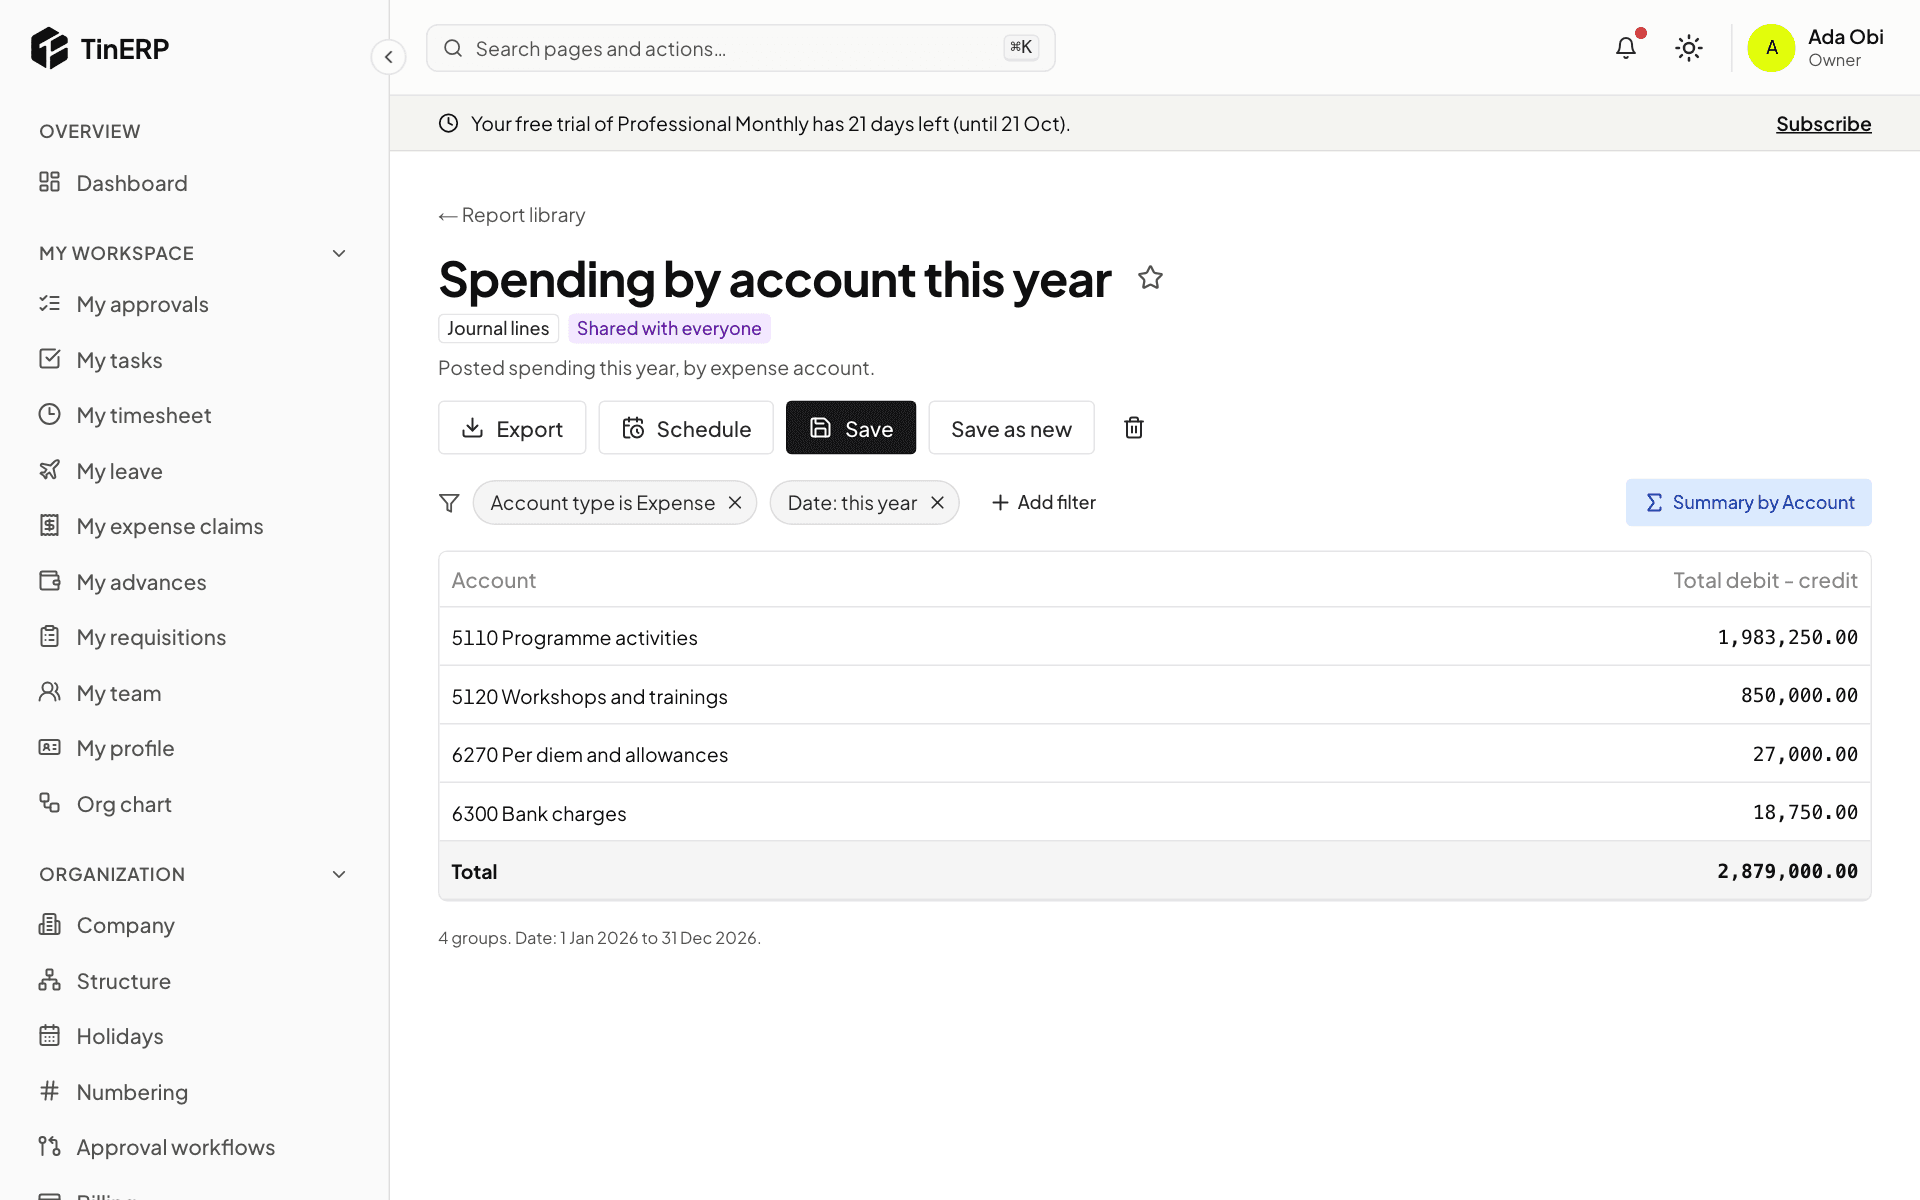
Select Summarize and choose: A list of rows; Group and total - up to three groupings (Then by) and up to four figures (count, total, average, lowest, highest), with a chart above the table if you like; or a Pivot - rows × columns × a figure, with totals across and down.
In a filter, My department follows whoever runs the report, so one shared report shows each manager their own department.
3. Save and share it
Select Save as a view, name it, and choose Who sees it: only you, some roles, or everyone. Each person who opens it sees what their own access allows. Only you can change it; others can Save as new.