Build and share your own reports
You don't need to write anything technical: you choose the data, the columns, the filters and how to summarize it.
- 1
Start a report
In the library, select New report and choose the data - employees, leave requests, purchase orders, expense claims, journal lines, timesheet entries and more, as your plan and access allow. Or open any report and change it.
- 2
Summarize it
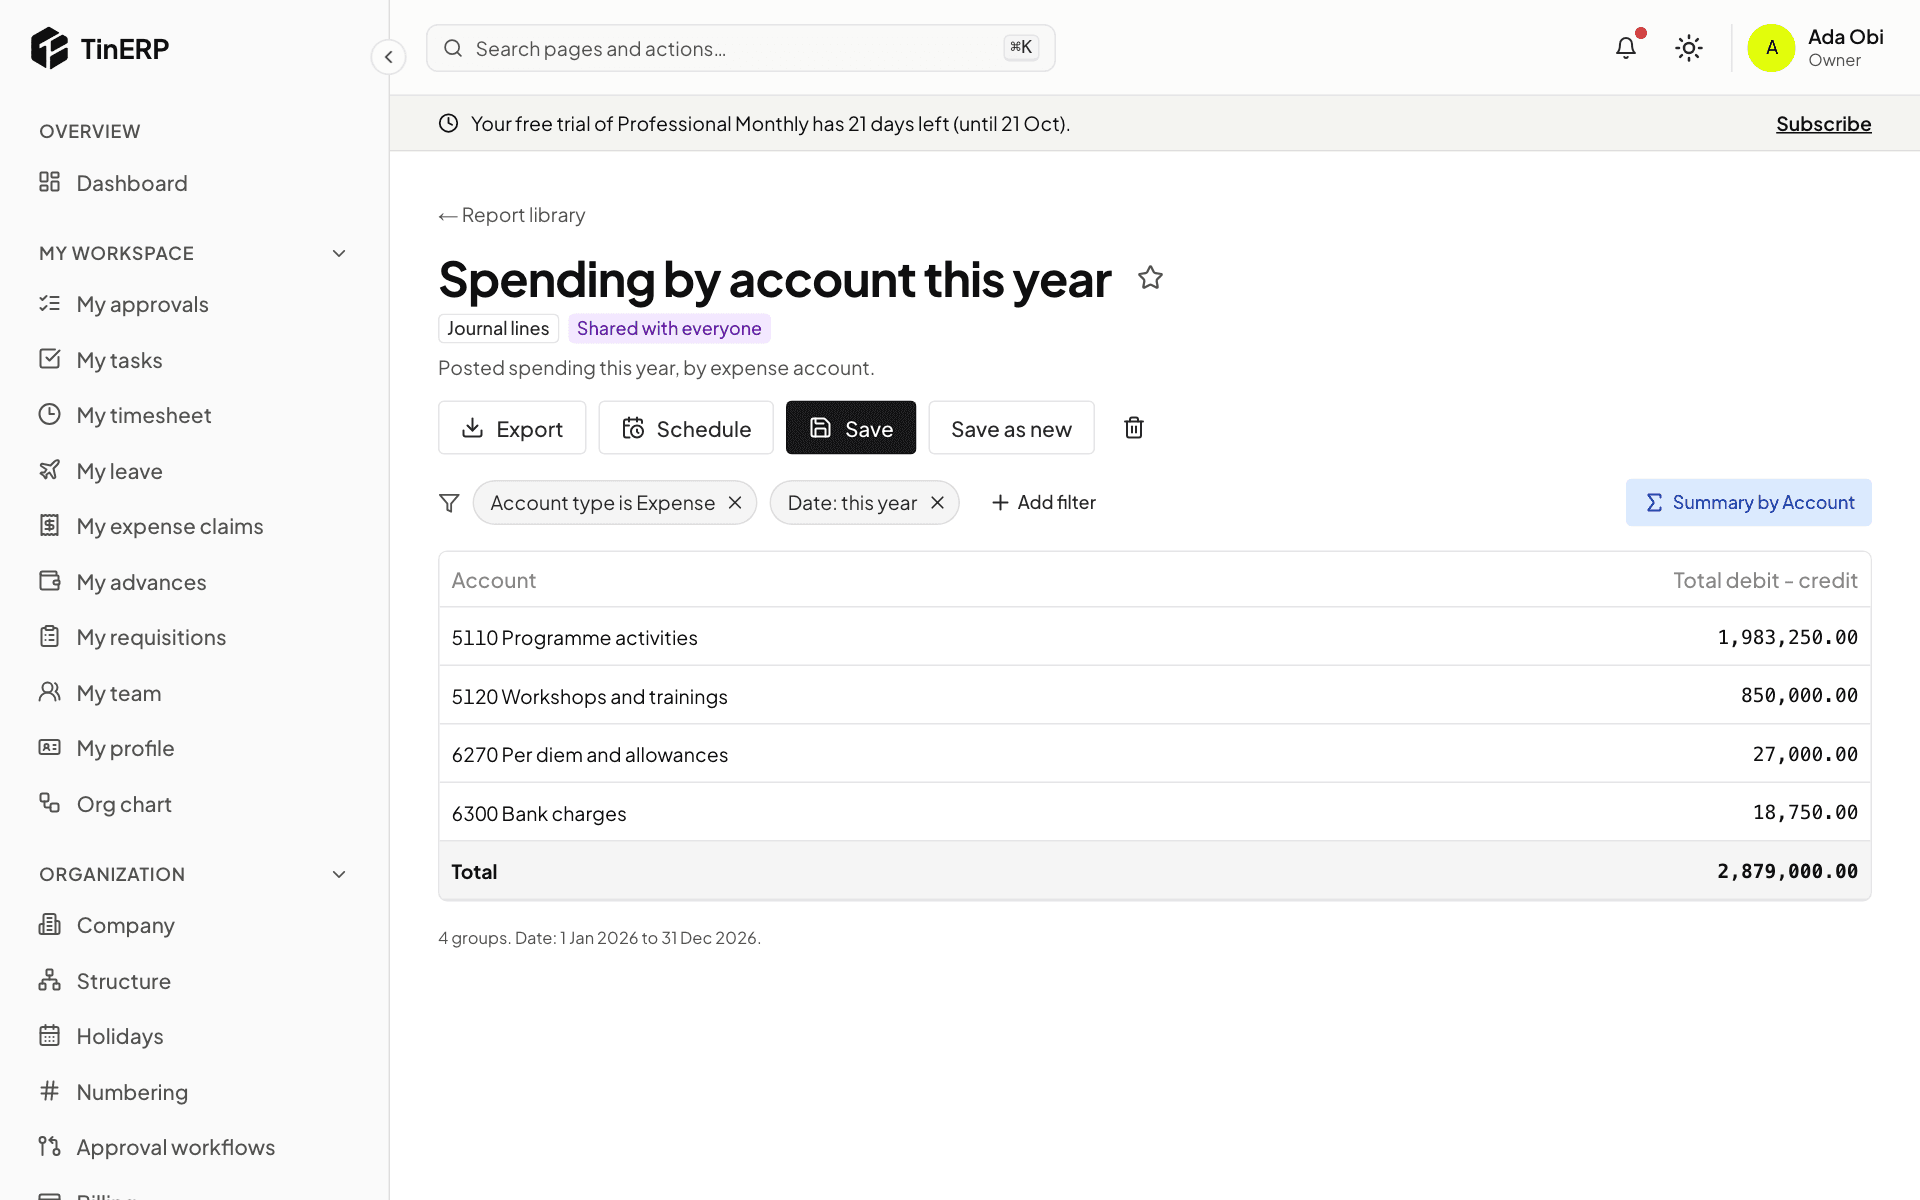
Select Summarize and choose: A list of rows; Group and total - up to three groupings (Then by) and up to four figures (count, total, average, lowest, highest), with a chart above the table if you like; or a Pivot - rows × columns × a figure, with totals across and down.
In a filter, My department follows whoever runs the report, so one shared report shows each manager their own department.
Full size
A saved view of spending by account, summarized by account, shared with everyone - 3
Save and share it
Select Save as a view, name it, and choose Who sees it: only you, some roles, or everyone. Each person who opens it sees what their own access allows. Only you can change it; others can Save as new.