Dashboards
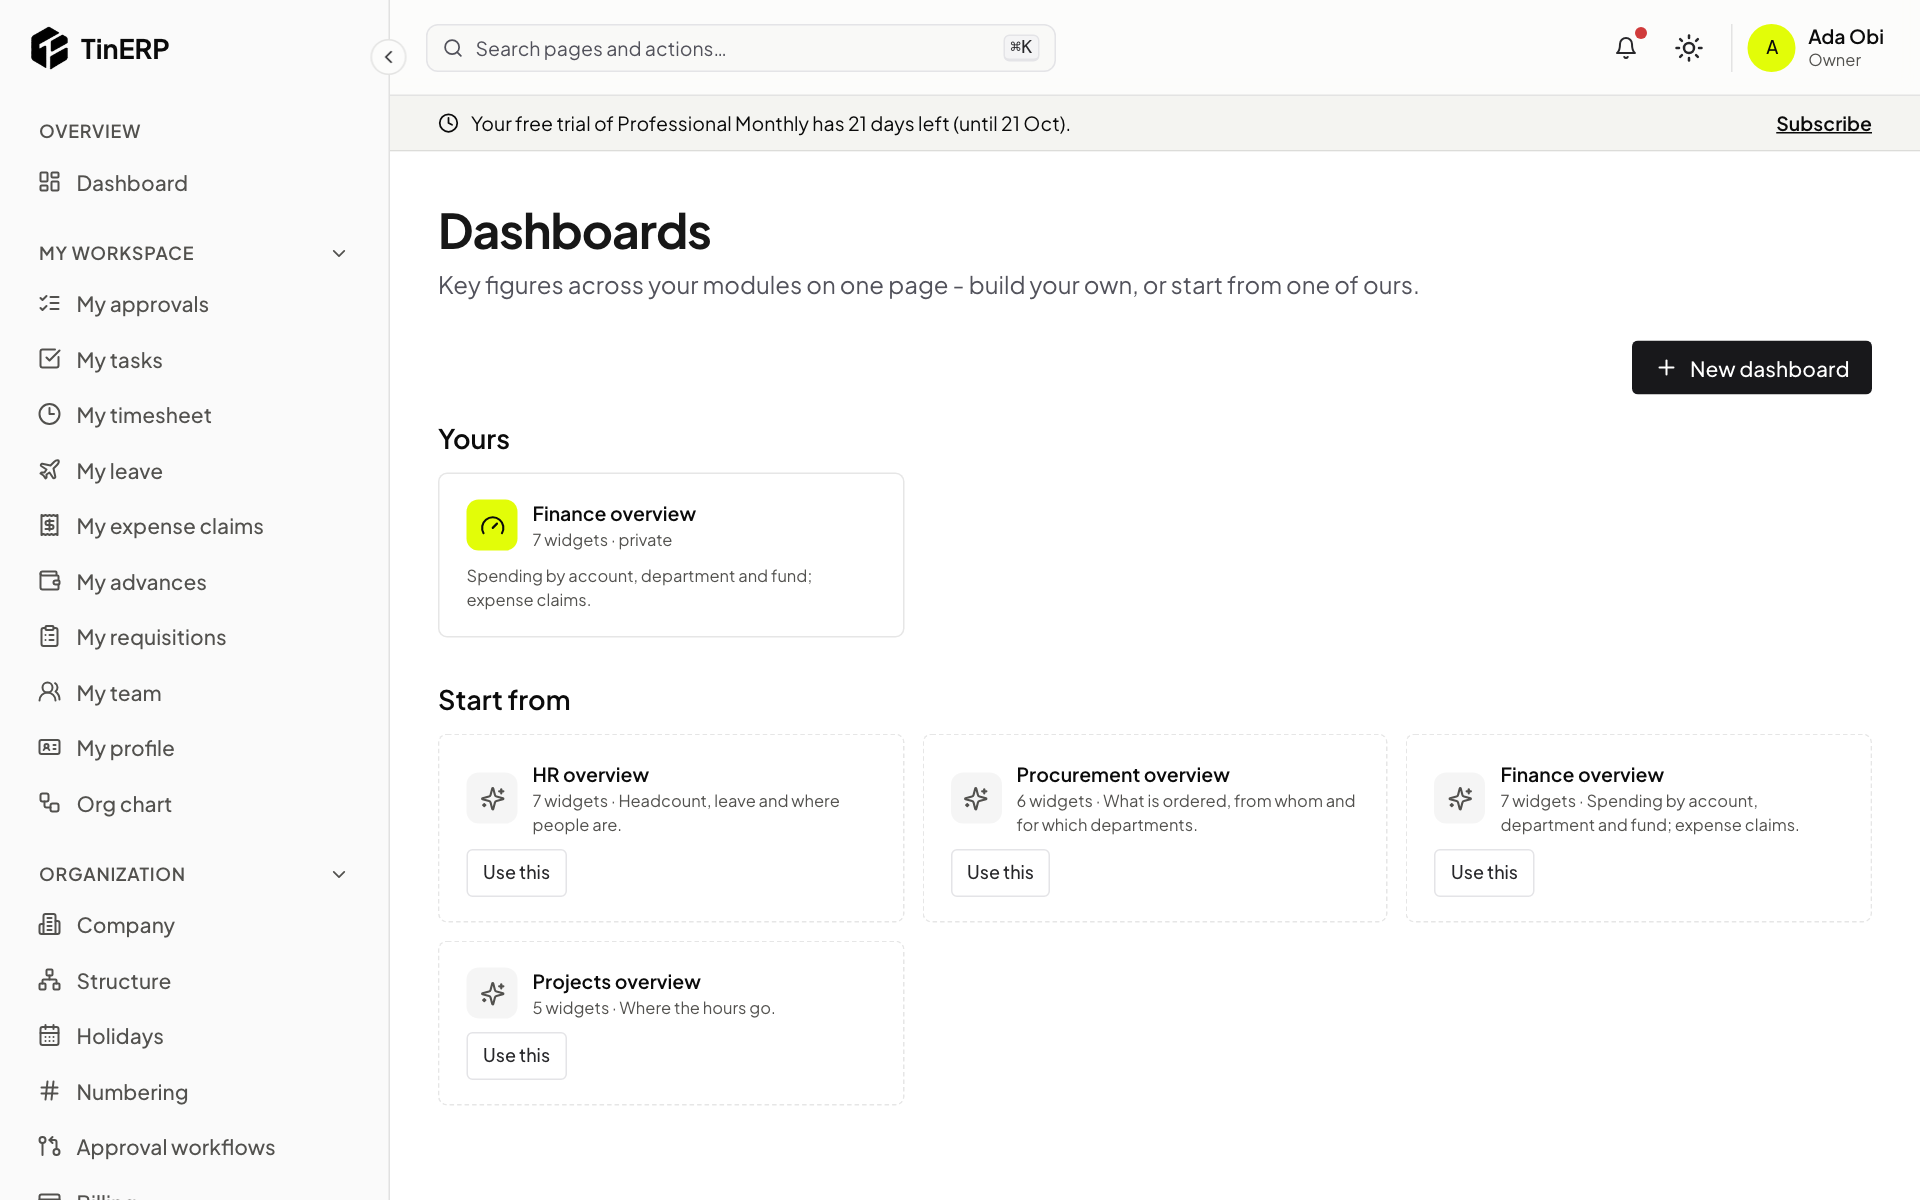
A dashboard puts the figures you watch on one page, for one date range and department, each opening the report behind it.
- 1
Start from one of ours
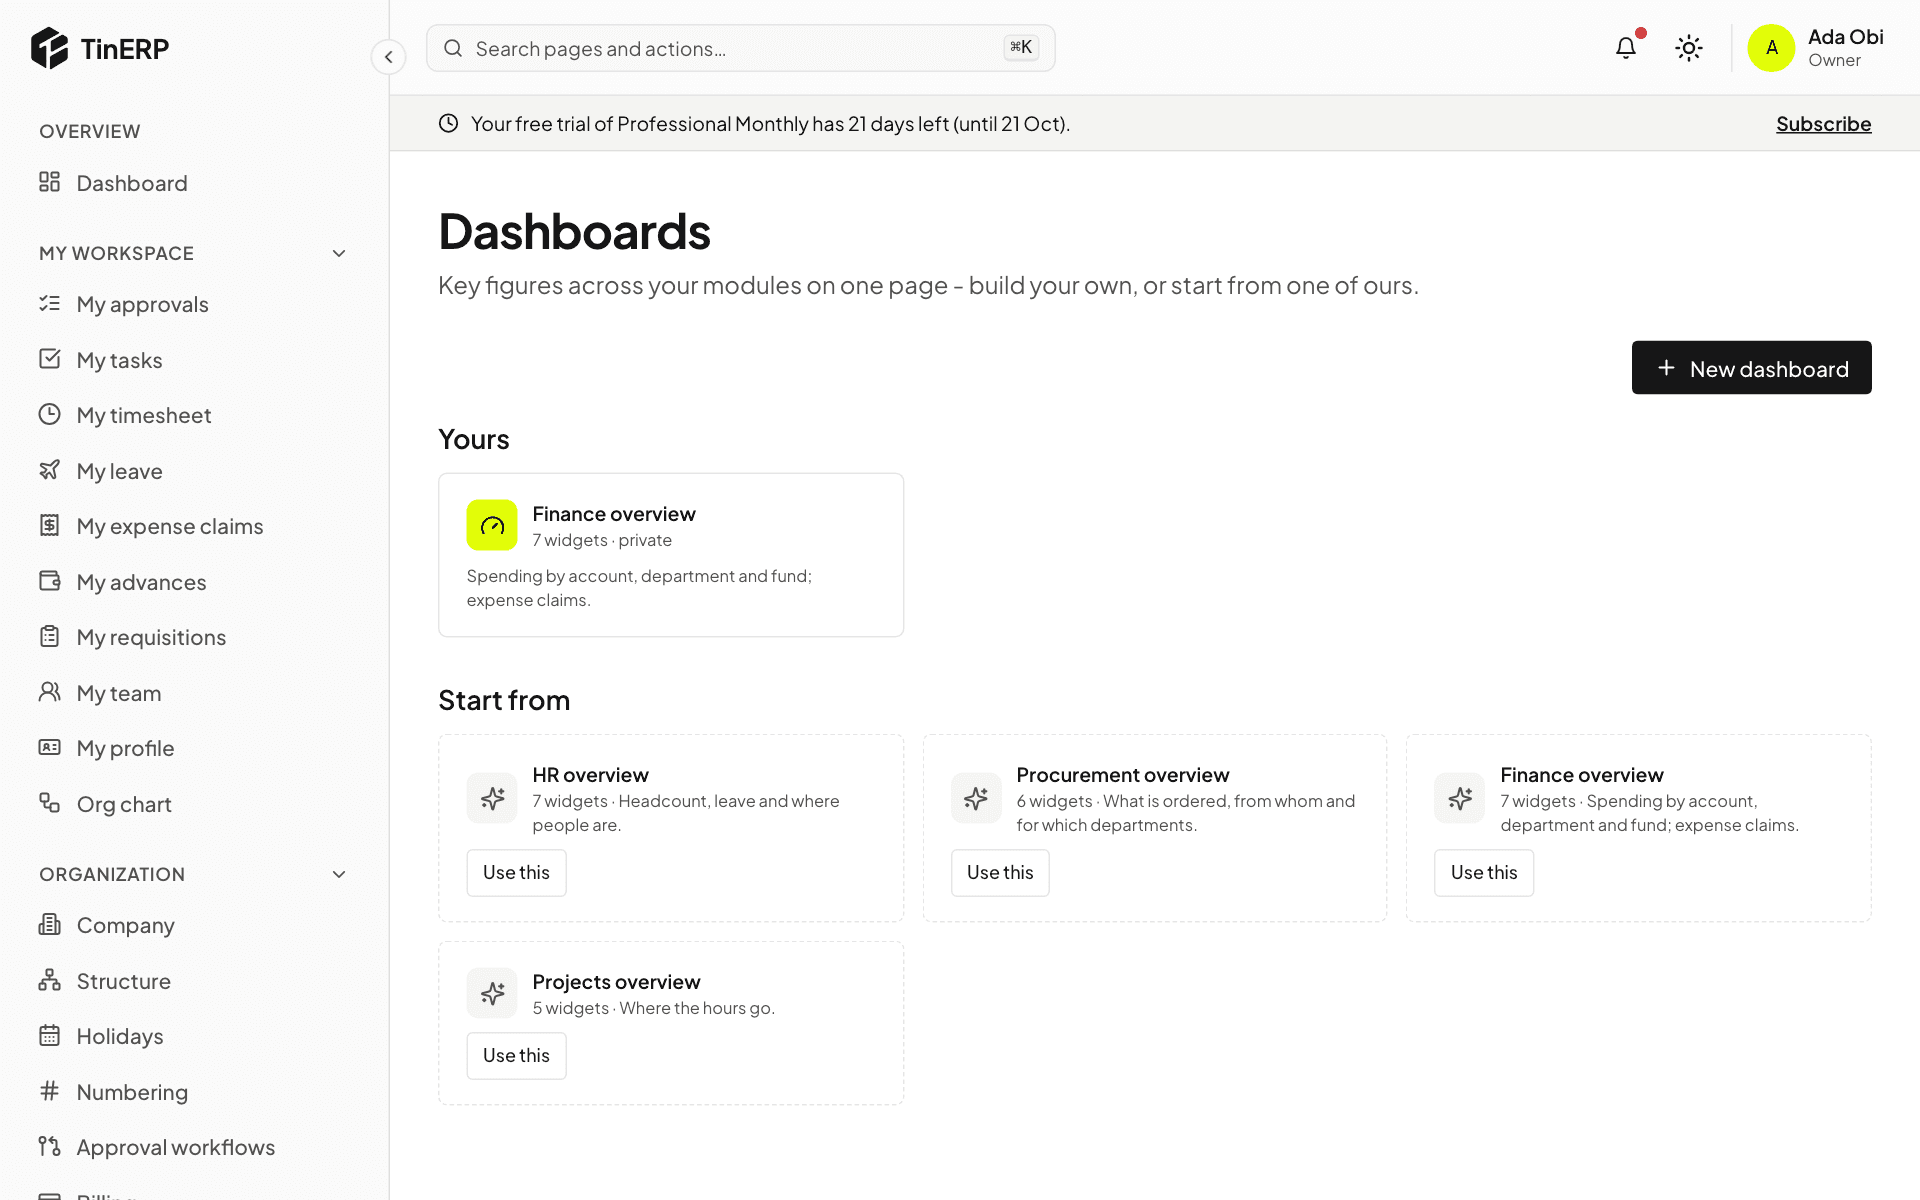
Go to Reports → Dashboards. Start from has an overview for each module in your plan - HR, Procurement, Finance, Projects. Select Use this to make it yours, or New dashboard to start empty.
Full size
Dashboards: yours, and the starters to copy - 2
Read it
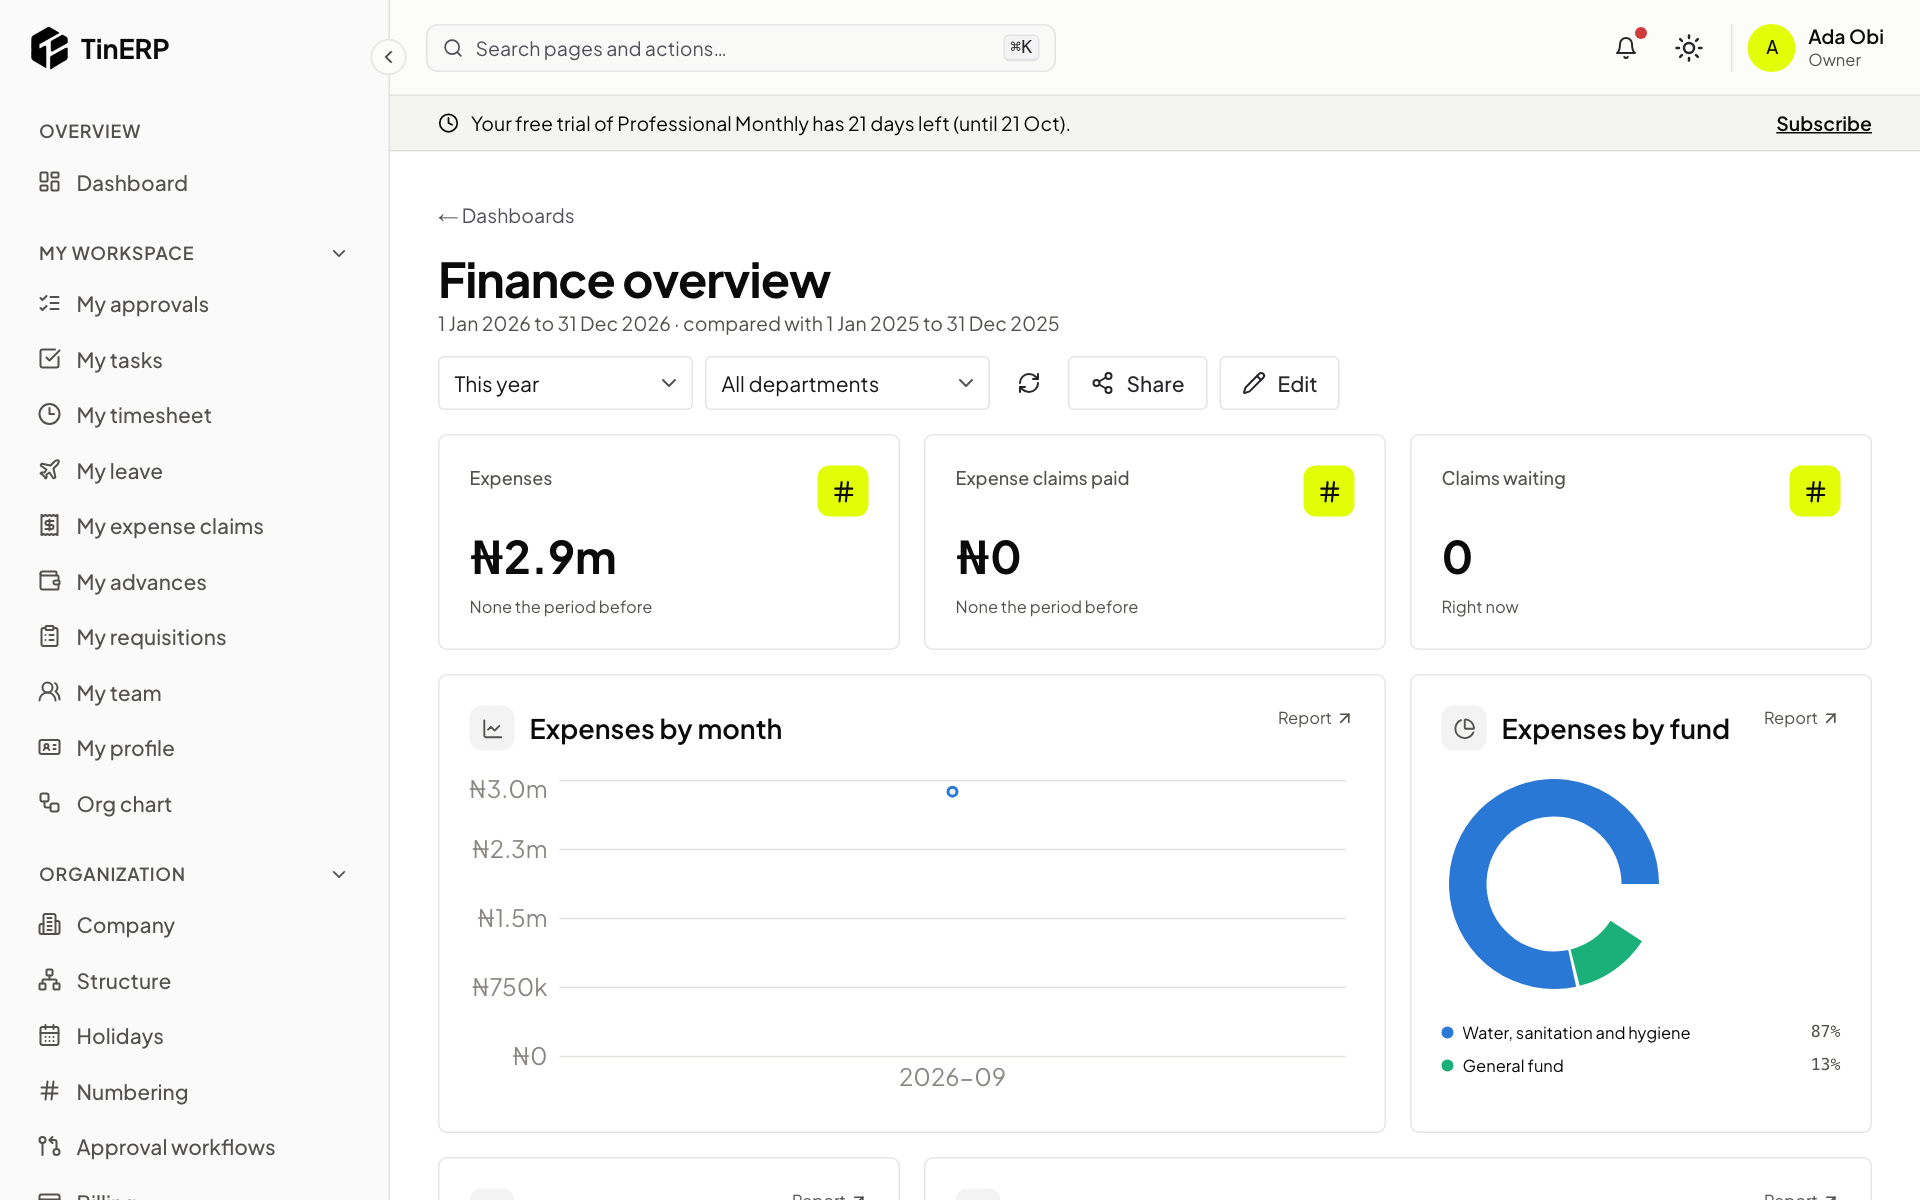
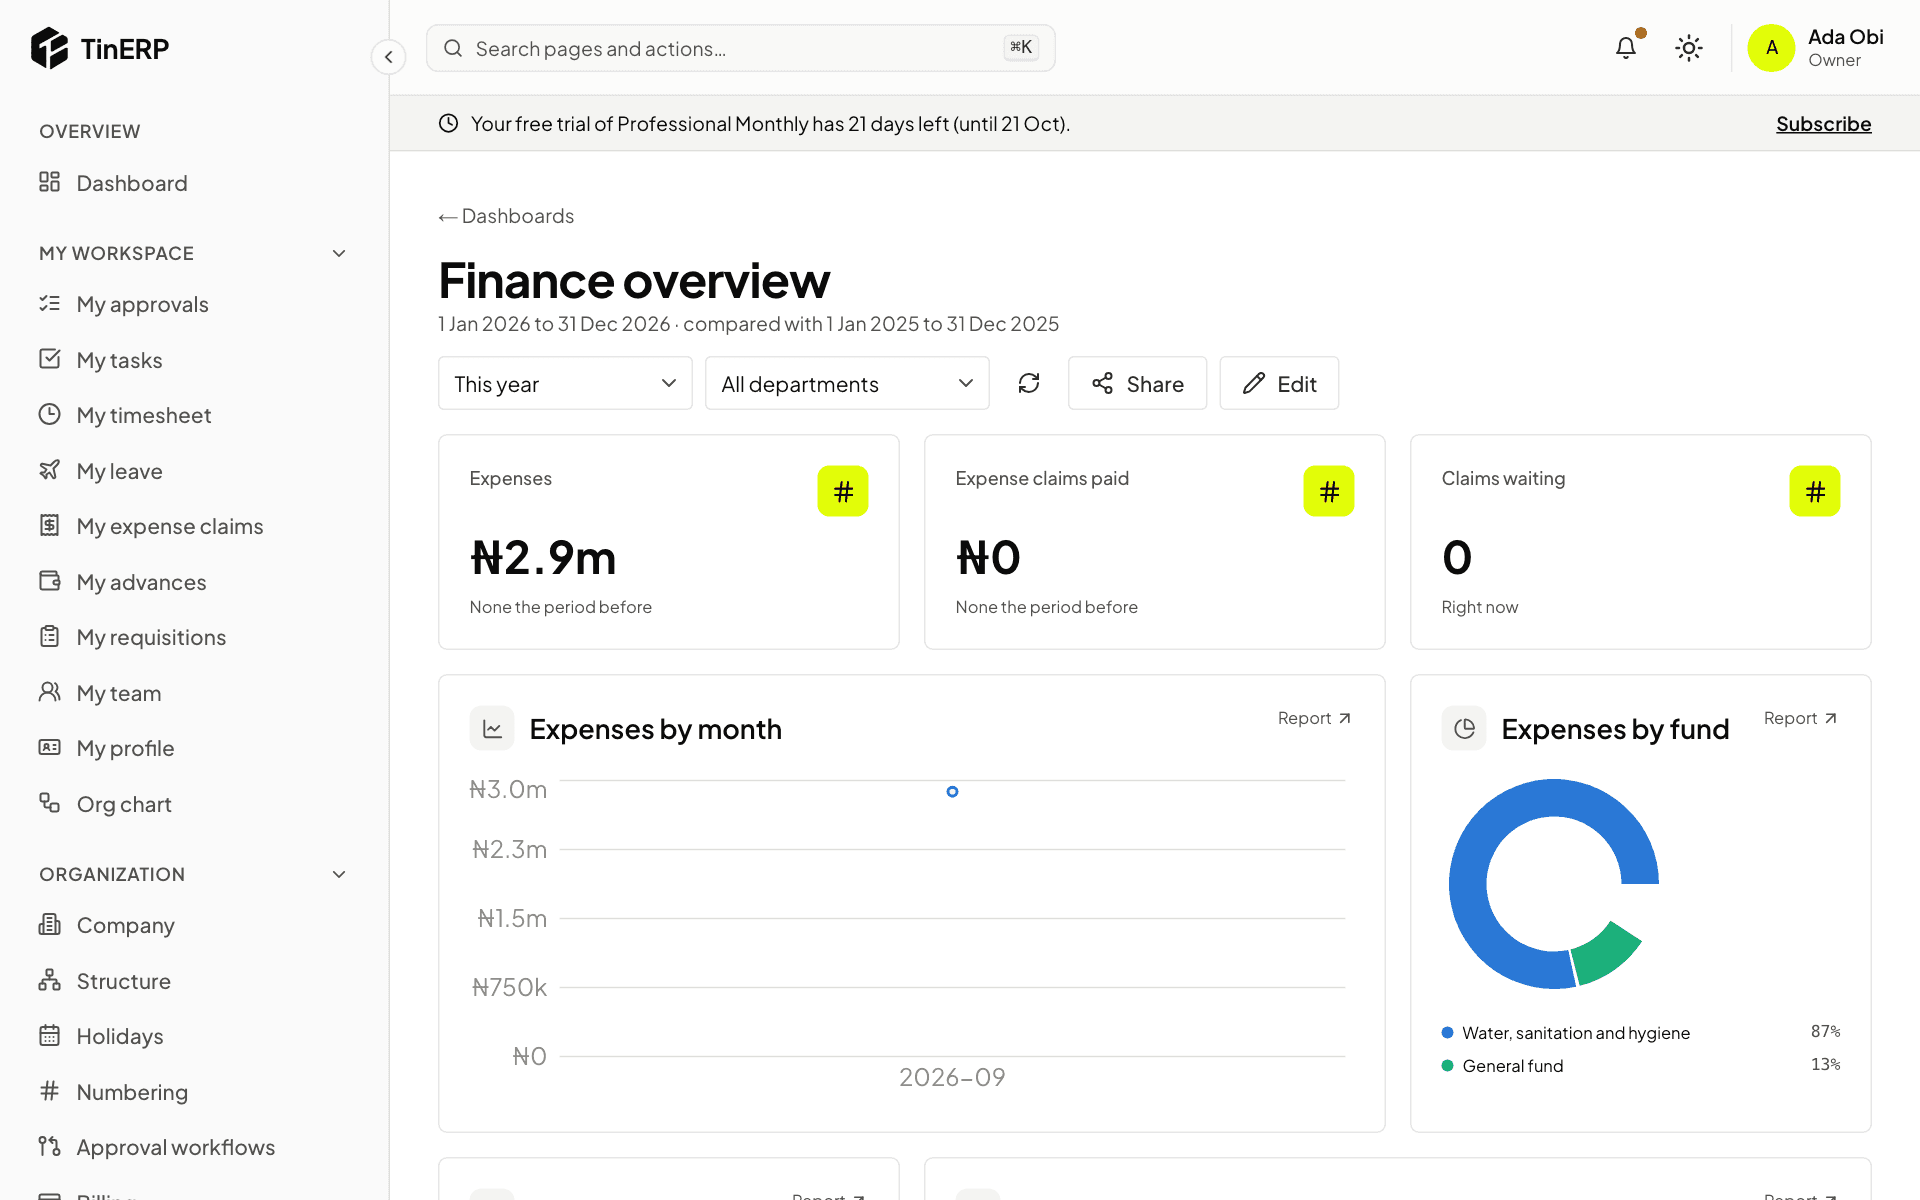
Choose the date range and department at the top - every widget that follows the dashboard's dates changes with them. Key figures show the change on the period before. Select Report on any widget for the figures behind it, ready to filter or export.
Full size
The Finance overview dashboard: expenses, claims, expenses by month and by fund - 3
Make it yours
Select Edit, then Add a widget: choose the data, show it as a Key figure, Bar chart, Trend line, Donut, Ranked list or Table, and its width. Move and resize widgets; everything saves as you go.
Share it with roles or everyone - and make it a role's default - if your role allows. Each viewer sees their own access.